
Monitoring Infrastructure
The Infrastructure Monitoring service uses API-based monitoring for cloud provider-level metrics or agent-based monitoring, to provide a detailed view of operating system metrics, including databases and applications. Monitoring of your cloud resources is automatically discovered and included in your service.
Deployment of Operating System agents is controlled by changing a SoftwareOne-specific agent deployment tag on the desired resource. We then use Automation to deploy the agents within 24 hours of detecting the tags on your resource.
For AWS infrastructure:
Items with defined thresholds are monitored using SoftwareOne’s AWS Monitoring Baseline.
SoftwareOne have defined Incident Responses for each monitored item.
Items without defined thresholds and/or not present in the AWS Monitoring Baseline are not monitored.
Overview
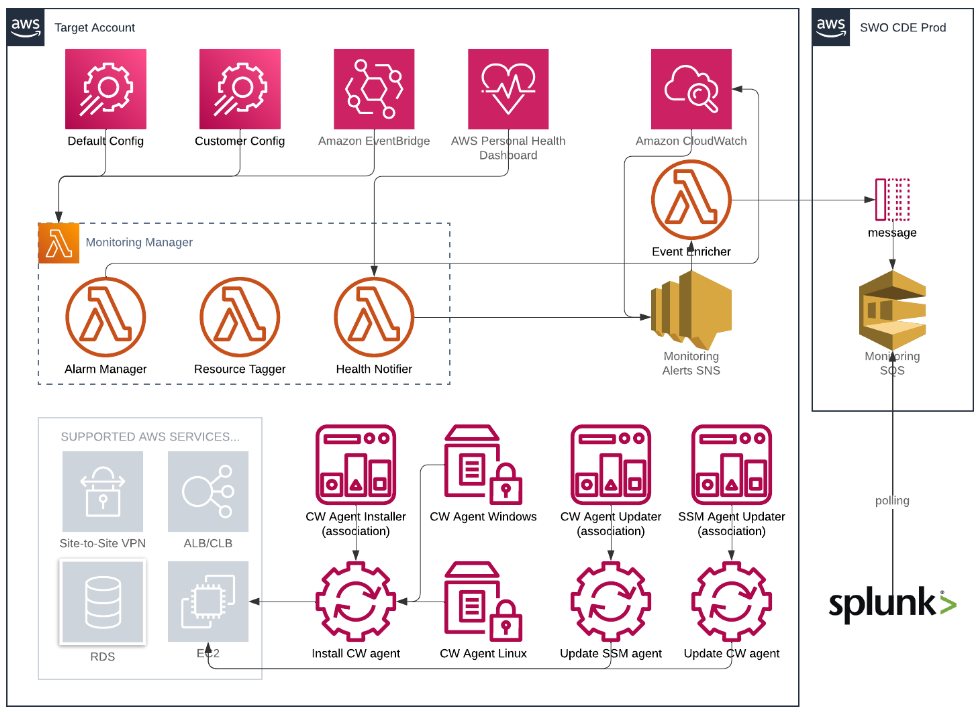
SoftwareOne configures and deploys alarms for applicable AWS resources, monitors these resources, and performs remediation when needed.
The monitoring system utilises AWS tools, such as the Resource Tagger and Alarm Manager, and takes advantage of native AWS services, such as Amazon EventBridge (previously known as CloudWatch) and AWS Health.
Infrastructure monitoring offers the following value:
A default configuration that creates, manages, and deploys policies across your managed account for all or supported AWS resources that you select.
A monitoring baseline so that you have a default level of protection, even if you don’t configure any other monitoring for your managed accounts. For more information, see Alerts from AWS baseline monitoring.
The ability to customize the baseline resource alarms to meet your requirements.
Automatic remediation of alerts by SoftwareOne Operations, when possible, to prevent or reduce the impact on your applications. For example, if you are using a standalone EC2 instance and it fails the system health check, SoftwareOne Operations attempts to recover the instance by stopping and restarting it. For more information, see AWS automatic remediation of alerts.
Investigation of alerts to determine the appropriate actions. For more information, see Incident management.
Alerts generated based on the configuration in your account and supported AWS services. The monitoring configuration of an account refers to all the resource parameters in the account that create an alert. The monitoring configuration of an account includes CloudWatch Alarm definitions and EventBridge (formerly known as CloudWatch Events) that generate the alert (alarm or event). For more information about the resource parameters, see Alerts from AWS baseline monitoring.
Notification of imminent, ongoing, receding, or potential failures; performance degradation; or security issues generated by the baseline monitoring configured in an account (known as an alert). Examples of alerts include a CloudWatch Alarm, an Event, or a Finding from an AWS service, such as AWS Health.
Monitoring Baseline
The following AWS services are included in the service:
EC2 Instances
Linux
Windows
VPN Connection
Elastic Load Balancing (CLBs)
Elastic LoadBalancing V2 (ALBs)
RDS DBCluster (Aurora Clusters)
RDS DBInstance (RDS Instances)
RDS Service Events
AWS Backup
Personal Health Dashboard Events
GuardDuty Findings
Implemented alarm definitions
EC2 Instances
Linux
Metric | Threshold | Duration | Description |
|---|---|---|---|
CPUUtilization | > 95% | for 5 mins, 6 consecutive times. | Alarm if CPU utilization is above 95%. |
StatusCheckFailed_System | > 0 | for 5 mins, 3 consecutive times | Alarm if OS not responding and perform recover on the instance. |
StatusCheckFailed_Instance | > 0 | for 5 mins, 3 consecutive times | Alarm if VM not responding and perform reboot on the instance. |
mem_used_percent | > 95% | for 5 mins, 6 consecutive times. | Alarm if RAM Utilization is above 95%. |
disk_used_percent | > 95% | for 5 mins, 6 consecutive times. | Alarm if Disk Space is above 95%. |
Windows
Metric | Threshold | Duration | Description |
|---|---|---|---|
CPUUtilization | > 95% | for 5 mins, 6 consecutive times. | Alarm if CPU utilization is above 95%. |
StatusCheckFailed_System | > 0 | for 5 mins, 3 consecutive times | Alarm if OS not responding and perform recover on the instance. |
StatusCheckFailed_Instance | > 0 | for 5 mins, 3 consecutive times | Alarm if VM not responding and perform reboot on the instance. |
Memory % Committed Bytes In Use | >= 95% | for 5 mins, 6 consecutive times. | Alarm if RAM Utilization is above 95%. |
LogicalDisk % Free Space | <= 5% | for 5 mins, 6 consecutive times. | Alarm if Free Disk Space is below 5%. |
VPN Connection (Site-to-Site VPNs)
Metric | Threshold | Duration | Description |
|---|---|---|---|
TunnelState | <= 0 | for 1 min, 20 consecutive times. | Alarm if VPN Connection is down. |
Elastic Load Balancing (CLBs)
Metric | Threshold | Duration | Description |
|---|---|---|---|
SpilloverCount | > 1 | for 1 min, 15 consecutive times. | Alarm if excess number of requests were rejected because the surge queue is full. |
HTTPCode_ELB_5XX | > 0 | for 5 mins, 3 consecutive times. | Alarm if excess number of HTTP 5XX response codes originate from the load balancer. |
SurgeQueueLength | > 100 | for 1 min, 15 consecutive times. | Alarm if an excess number of requests are pending routing. |
Elastic LoadBalancing V2 (ALBs)
Metric | Threshold | Duration | Description |
|---|
Metric | Threshold | Duration | Description |
|---|---|---|---|
ErrorRate | > 15 | for 1 min, 5 consecutive times. | Alarm if excess number of HTTP 5XX response codes are generated by the ALB. |
RejectedConnectionCount | > 0 | for 1 min, 5 consecutive times. | Alarm on the number of connections rejected because the ALB reached its maximum. |
RDS DBCluster (Aurora Clusters)
Metric | Threshold | Duration | Description |
|---|---|---|---|
CPUUtilization | > 90% | for 20 mins, 5 consecutive times | Alarm if CPU utilization is above 90%. |
RDS DBInstance (RDS Instances)
Metric | Threshold | Duration | Description |
|---|---|---|---|
CPUUtilization | > 75% | for 15 mins, 2 consecutive times. | Alarm if CPU utilization is above 75%. |
FreeStorageSpace | < 1073741824 bytes | for 5 mins, 2 consecutive times. | Alarm if FreeStorageSpace is below 1GB. |
ReadLatency | > 1.01 seconds | for 5 mins, 2 consecutive times. | Alarm if ReadLatency is above 1.01 sec. |
WriteLatency | > 1.01 seconds | for 5 mins, 2 consecutive times. | Alarm if WriteLatency is above 1.01 sec. |
AWS Backup
Metric | Threshold | Duration | Description |
|---|---|---|---|
NumberOfBackupJobsFailed | > 0 | for 5 mins, 1 consecutive time. | Alarm if AWS Backup job fails. |
NumberOfBackupJobsExpired | > 0 | for 5 mins, 1 consecutive time. | Alarm if expired AWS Backup job cannot be deleted. |
NumberOfRestoreJobsFailed | > 0 | for 5 mins, 1 consecutive time. | Alarm if AWS Backup restore job fails. |
NumberOfRecoveryPointsExpired | > 0 | for 5 mins, 1 consecutive time. | Alarm if expired AWS Backup recovery point cannot be deleted. |
This section includes the topics: